Voyant is a text-mining tool that allows the user to visually explore individual words in relationship to a body of textual data. For the purposes of clarity, Voyant defines the entire body of textual data as the corpus while an individual portion of the textual data is called a document. Voyant allows the user to adjust the SCALE of the data by moving between the entire corpus and an individual document.
This exercise uses textual data from the Works’ Progress Administration Slave Narratives housed in the Library of Congress. PA Slave Narratives. The collection came together between 1936-1938 when staff of the Federal Writers’ Project of the Works Progress Administration gathered over 2,300 first-person accounts from formerly enslaved people in seventeen states.
Metaphorically, Voyant is set up much like a Swiss Army Knife in that it contains a variety of specialized tools to help the user extract the most meaning out of the data. However, for ease of introduction, this post will cover only some of the most straightforward default tools. For any given word, Voyant is able to:
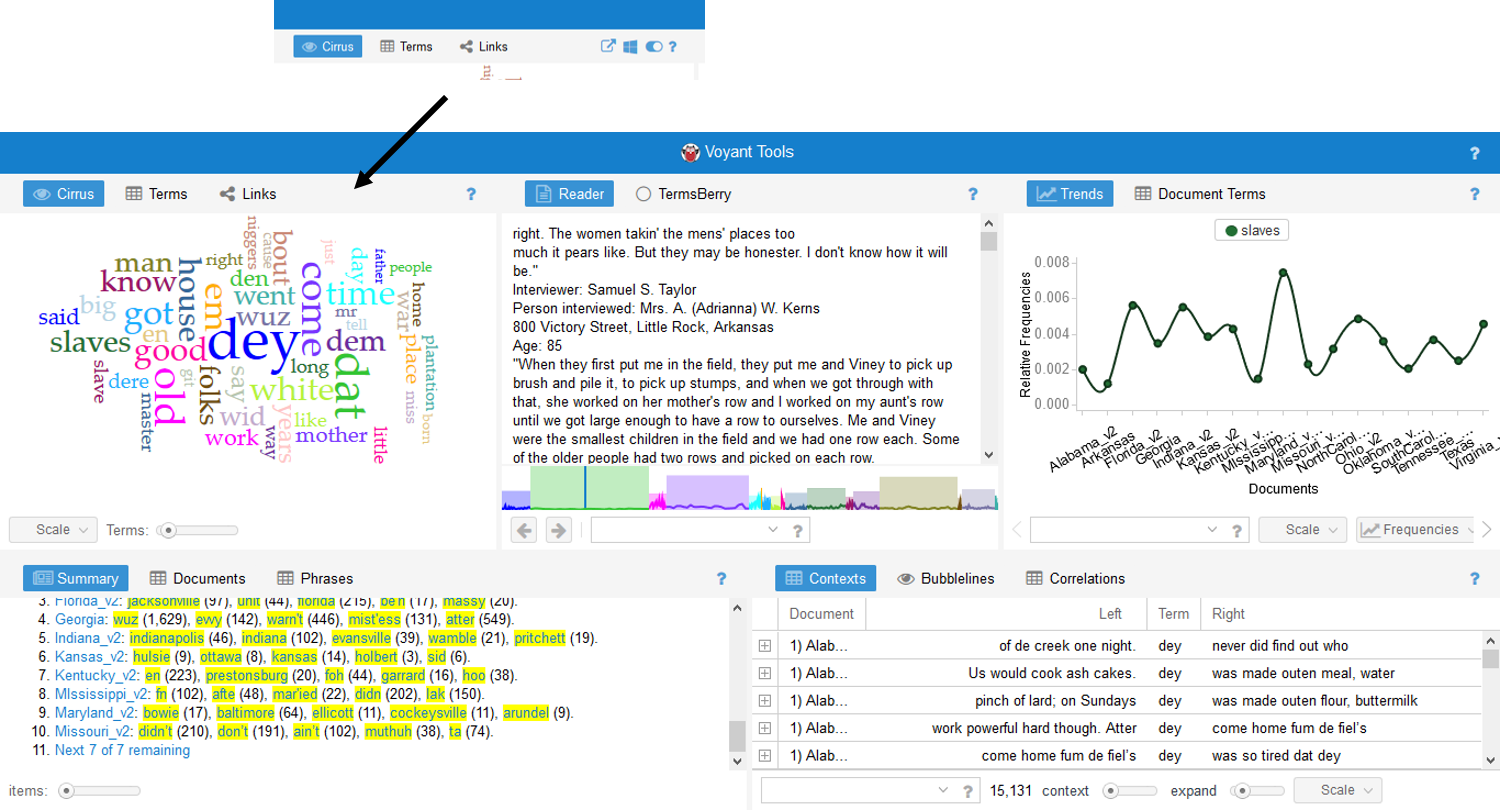
- visually represent the word in a cloud and express word frequency numerically by scrolling over any given word. This is the default CIRRUS view.
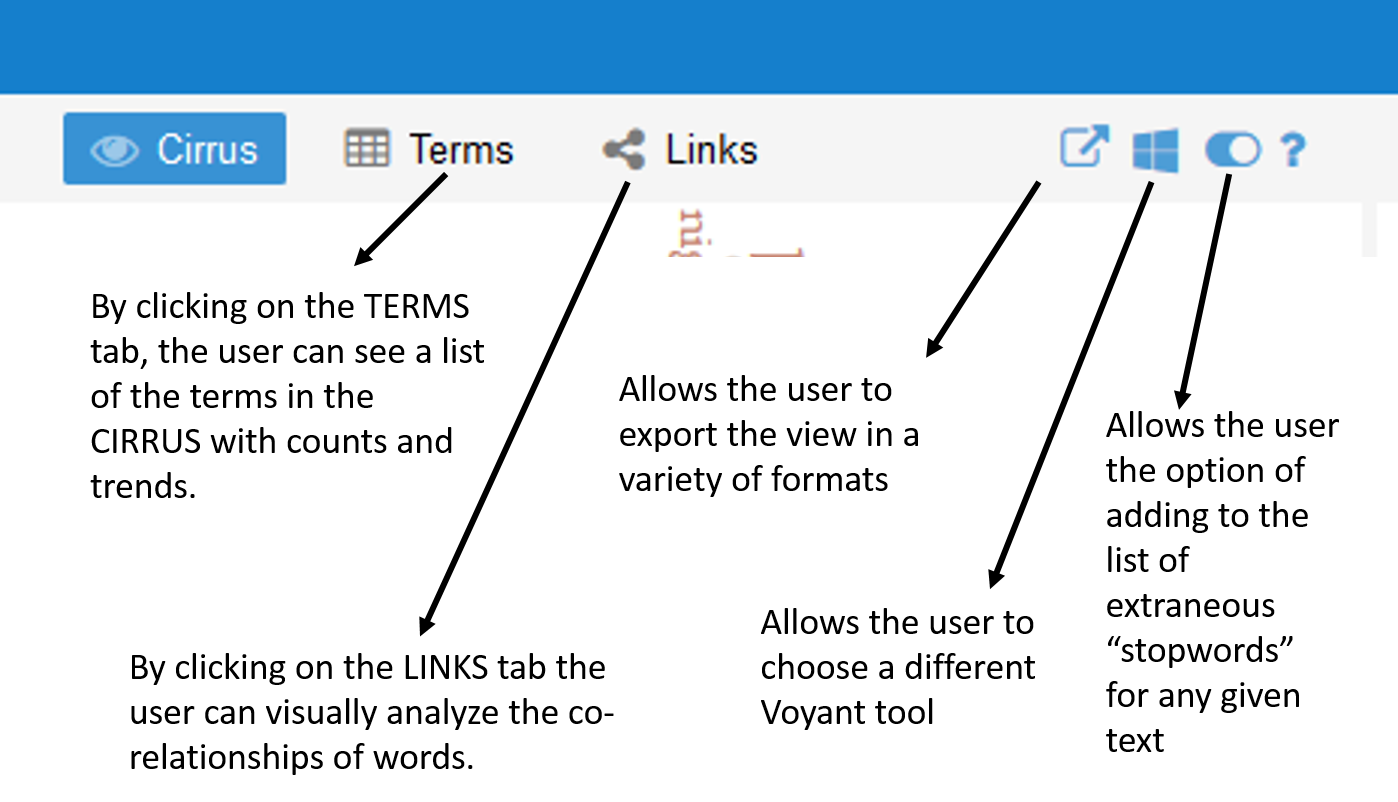
- By clicking on the TERMS tab, the user can see a list of the terms in the CIRRUS with counts and trends.
- By clicking on the LINKS tab the user can visually analyze the co-relationships of words.
- easily locate any given word in a comprehensive list of the places in which it appears in context throughout the larger corpus. This is called the CONTEXT view.
- explore words in the larger context of a document and see the size of the document in relationship to the corpus. This is called the READER view, and it allows the user to see where in the document the word appears.
- graph word frequency (raw or relative) over the corpus or in only one document. This is called the TRENDS view, and it also allows the user to change the type of graphs.
- compare information about the documents as each relates to the corpus including relative length, vocabulary density, distinctive words, etc. This is called the SUMMARY view.
To begin, open up Voyant in a web browser. For shorter amounts of text like a political speech or magazine article, one may copy and paste text directly into the window. Larger bodies of text may be uploaded directly from a file or from URLs containing text files. Clicking REVEAL will open up the Voyant default tools described above.
Each tool panel allows the user to toggle back and forth between functionalities. For example, the CIRRUS tool also allows the user to view the data by TERMS and LINKS. And, each tool panel allows the user to export data, change tools or define options for how the tool is being used.
Exploring the CIRRUS tool, the user can now see a visual representation of word frequency. The user may change the SCALE of the information by applying the tool to the entire CORPUS or to only one DOCUMENT. In the case of this visualization, the DOCUMENTS are categorized by state. The user may also broaden the number of TERMS shown in the CIRRUS view. Clicking on the options button allows the user to remove extraneous stop-words. In this case colloquialisms such as ain’t have been removed in addition to words such as is and not.
Certainly, many of the words highlighted in this word cloud should make viewers uncomfortable. And, at least one of these words has come to the fore in the media this week when a school district in Mississippi removed To Kill a Mockingbird from its eighth grade curriculum. As a teacher of literature and history, omitting this powerful work makes me uncomfortable and profoundly sad. However, using tools like Voyant in analyzing the language of the 1930s slave narratives could help readers to understand the historical context of why Lee chose to include this word in her novel about racial and social injustice.
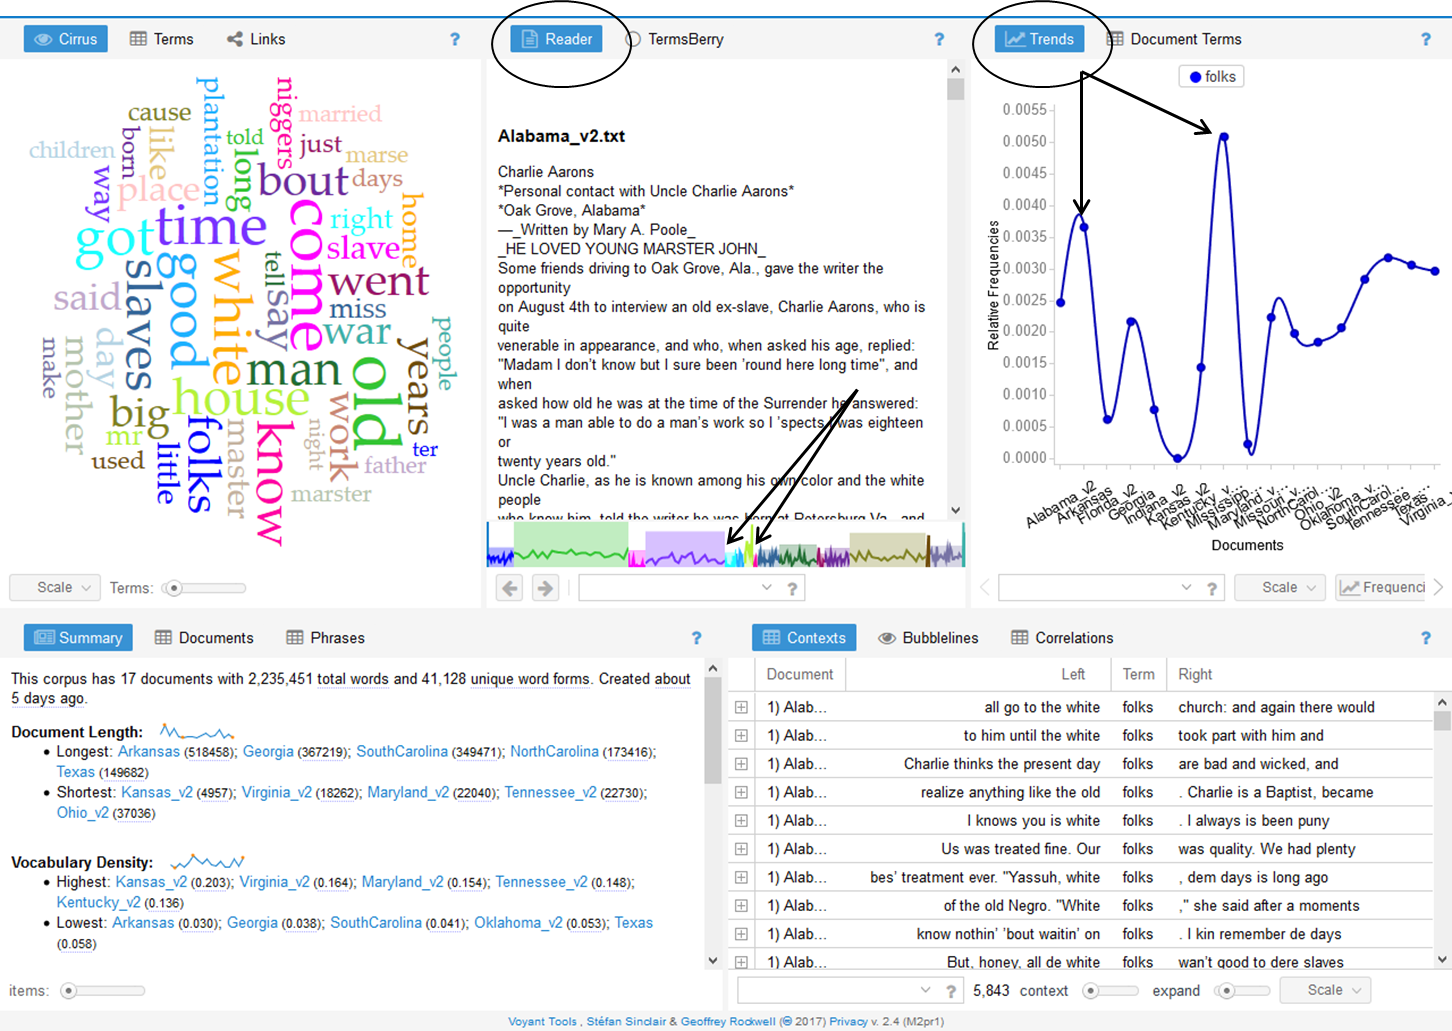
Noticing that many of the words reveal a connotation to a person’s place in the community, I chose to analyze the words people and folks to study how the interview subjects’ description of themselves or others was related to geographical differences in dialect. Looking at the cirrus, I am able to see that people is used 2,667 times and folks is used 5,843 times. I am also able to view commonly linked words such as church and white.
Across the corpus, the states of Maryland and Kansas seem to have a high use of this word. However, in exploring the data in the reader view, it becomes evident that the number of documents for each state is relatively small compared to the larger corpus.

The TRENDS view shows a high relative frequency of the word “folks” in the documents from Maryland and Kansas. However, by looking at the colored graph at the bottom of the READER view, the user is able to understand that the size of the Kansas and Maryland documents are relatively small in relation to the larger corpus.
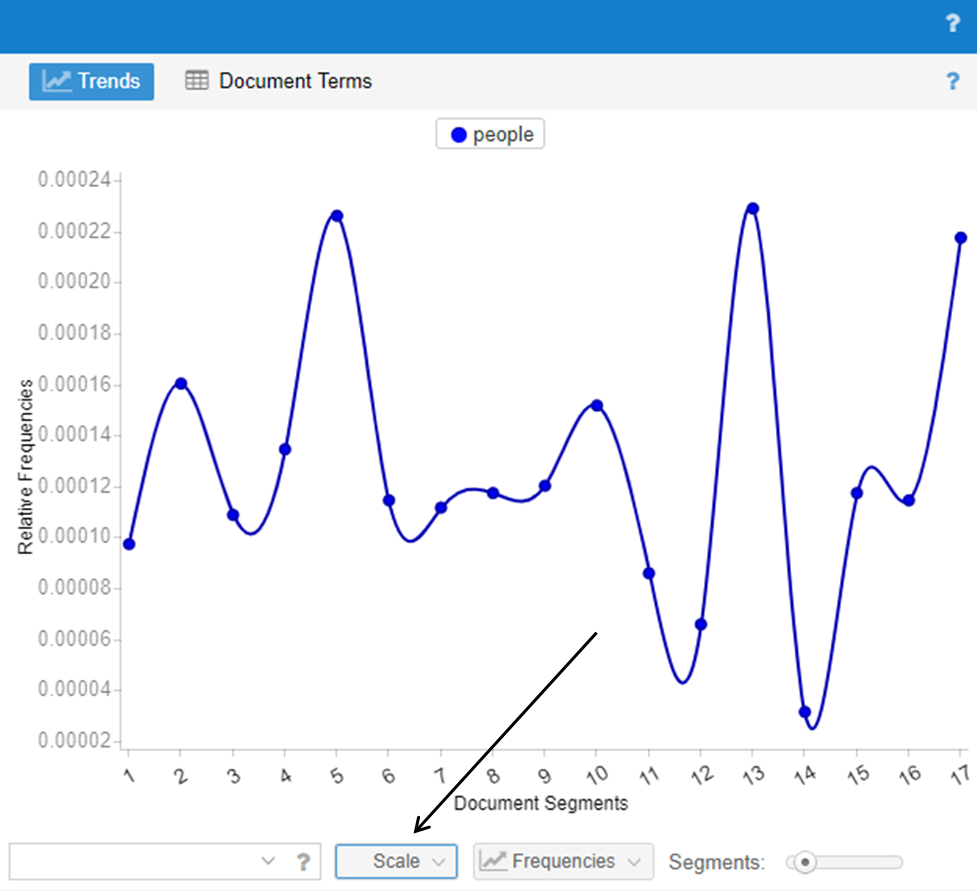
Using the TRENDS view Voyant is also helpful in analyzing raw frequency vs. relative frequency across the corpus. The word people also appears relatively frequently in Maryland and Kansas. The READER view has helps in understanding that these data sets are small. However, the body of data for South Carolina, the third most common place the word is used, is much larger, and in analyzing the raw frequencies of the use of people within that particular document, the word seems to be somewhat more consistently used.

Trend graph of the use of the word “people” in South Carolina. To do this, click on the SCALE button and toggle the selection to reflect a particular document (South Carolina) rather than the entire corpus.
Thus, this shows that that the initial visualization of the word cloud is helpful for highlighting words but that it is important to dig down into the data for each word before drawing conclusions.
The SUMMARY and CONTEXT tools are helpful in finding the unexpected. For example, the SUMMARY tool allows the user to discover distinctive words in the documents. By looking at these words in the CONTEXT tool pane, the user can determine if they are place names, family names or unusual colloquial terms such as the the words pateroles and massy from the summary window. Again, by consulting the READER and TRENDS views, the user can see that pateroles only seems to appear in the text from Arkansas; however, the use of the word seems to be fairly well distributed across the document. One can also glean from the READER view that pateroles is a colloquial expression for patrols meant to constrain the movements of slaves within the community.
Thus, these features help the user to find something that wouldn’t be inherently apparent by initially looking only at the word cloud. They help the user to look more carefully at the document without having to wade through the entire corpus in order to discover something unexpected – a word that wasn’t initially on the radar – and is perhaps far more interesting than the initial search question.
Voyant is a powerful tool, but it can sometimes be a bit unwieldy in terms of exporting data. I found taking screenshots of data images was far more efficient than trying to export URLs or embed codes for data points that were buried more deeply in the data. Working with it directly on a desktop in order to explore data might be more efficient, though it is not as effective in publishing data than can be manipulated by others.
All in all, Voyant seems to be an effective tool in helping users understand and compare texts. As a teacher, I may explore how it could be used to analyze language in political speeches as part of a unit on persuasive language in the context of a literary study of Animal Farm. And, as mentioned above, the tool could be used on a basic level to help students dig into primary source documents to understand colloquial language in texts like To Kill a Mockingbird or The Color Purple.


